
Wider Drought Perspective
Reader asked for it, here it is. The map below is precipitation the last 60 days. Green = 2-4" and red = 20" (!) or more.
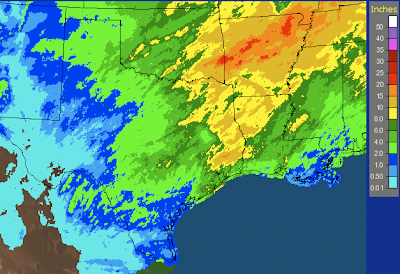
Yes, the drought continues to be quite severe in south Texas, New Mexico, and southeast Louisiana (the latter is getting rain right now).
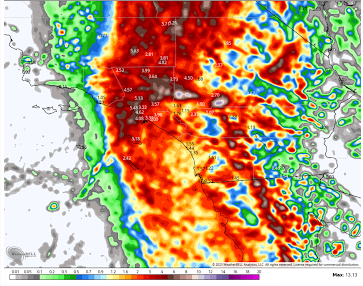
Here is a map of percentage of normal precipitation the last 60 days. Scale at right.


Yes, the drought continues to be quite severe in south Texas, New Mexico, and southeast Louisiana (the latter is getting rain right now).
Here is a map of percentage of normal precipitation the last 60 days. Scale at right.

Comments
Post a Comment