
2011: A Year of Precipitation in Map Form
Here is how much precipitation (rain and the melted moisture in snow) has fallen since 6am CST on January 1, 2011 until 6am this morning. Click to enlarge, scale at right.
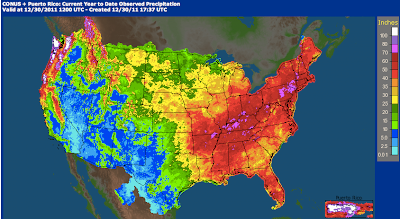 While the eye is certainly drawn to the purples (more than 70"!) from the Missouri Bootheel to southern New York, those are not the largest departures from normal. Those can be seen in the map below:

The greatest deviation from normal on the plus side is in eastern Montana. This very heavy spring rainfall is what put the Missouri River above flood stage so many days this spring and summer.
The driest area is about the same longitude, the southern Rockies down to the Texas Big Bend where rainfall was less than 20% of normal.
Comments
Post a Comment