A Defective Moral Compass?
NASA's Dr. Jim Hansen is at it again:
My question is: What global warming??!!
Normally, you see the UK Hadley Center's (don't worry, they are strongly pro-global warming) world temperature figures on this blog. I use their figures for consistency and because I believe they are the least "fudged" among the terrestrial temperature data sets (I also use the University of Alabama satellite temperature measurements at times and label them as such).
But, here are Dr. Hansen's own figures for the last twenty years:
There is no warming the last fifteen years.
More importantly, how has Dr. Hansen's own -- and famous -- 1988 forecast held up? I have a copy of the paper and have read it several times. He posited three scenarios based on the rate of CO2 emissions. What he called "Scenario A" is the appropriate metric of the accuracy of his forecast since it is closest to the concentration of CO2 in the atmosphere.
The orange dot is Dr. Hansen's forecast and the blue dot is the actual temperatures averaged over the last twelve months. It is obviously far cooler than Dr. Hansen predicted.
If Dr. Hansen's forecasts were even close to correct (it is cooler than his most optimistic scenario which was based on much lower CO2 levels than are currently in the atmosphere) I would be the first to sound the alarm.
But, with temperatures level and at least some signs the sun may -- repeat, may -- be trending toward cooler temperatures for an extended period time it strikes me as immoral be spending as much as we are on global warming and inefficient and expensive 'green' energy. We could be spending money on pure drinking water in the third world, malaria in Africa and other more serious, more "solvable," and less expensive problems to solve. I believe that would benefit mankind far more than throwing money at Al Gore.
ADDITION: 11:20pm.
"It's your money or your life," he said a press conference. "We are either going to dedicate ourselves to a cleaner, more livable planet and accept the initial investment necessary or we're going to pay a heavier price in terms of loss of human life, damage and costs associated with it."
The original news video where Sen. Durbin implies the Metroplex tornadoes were caused by global warming is here.
Twisters in Texas in Spring. Global warming: Is there anything it can't do?
My question is: What global warming??!!
Normally, you see the UK Hadley Center's (don't worry, they are strongly pro-global warming) world temperature figures on this blog. I use their figures for consistency and because I believe they are the least "fudged" among the terrestrial temperature data sets (I also use the University of Alabama satellite temperature measurements at times and label them as such).
But, here are Dr. Hansen's own figures for the last twenty years:
 |
| NASA data plotted by WoodforTrees.org |
More importantly, how has Dr. Hansen's own -- and famous -- 1988 forecast held up? I have a copy of the paper and have read it several times. He posited three scenarios based on the rate of CO2 emissions. What he called "Scenario A" is the appropriate metric of the accuracy of his forecast since it is closest to the concentration of CO2 in the atmosphere.
The orange dot is Dr. Hansen's forecast and the blue dot is the actual temperatures averaged over the last twelve months. It is obviously far cooler than Dr. Hansen predicted.
If Dr. Hansen's forecasts were even close to correct (it is cooler than his most optimistic scenario which was based on much lower CO2 levels than are currently in the atmosphere) I would be the first to sound the alarm.
But, with temperatures level and at least some signs the sun may -- repeat, may -- be trending toward cooler temperatures for an extended period time it strikes me as immoral be spending as much as we are on global warming and inefficient and expensive 'green' energy. We could be spending money on pure drinking water in the third world, malaria in Africa and other more serious, more "solvable," and less expensive problems to solve. I believe that would benefit mankind far more than throwing money at Al Gore.
ADDITION: 11:20pm.
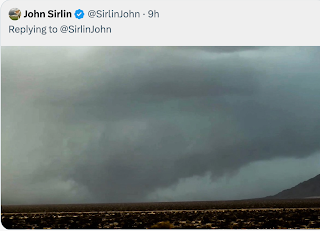
Sen. Dick Durbin reacts to the tornadoes in Dallas, Texas earlier this week.
"It's your money or your life," he said a press conference. "We are either going to dedicate ourselves to a cleaner, more livable planet and accept the initial investment necessary or we're going to pay a heavier price in terms of loss of human life, damage and costs associated with it."
The original news video where Sen. Durbin implies the Metroplex tornadoes were caused by global warming is here.
Twisters in Texas in Spring. Global warming: Is there anything it can't do?


True, Mike. Environmentalism is the chief secular religion and AGW is the chief dogma. Hansen is less and less a scientist these days. His issue advocacy makes him a priest in this metaphor.
ReplyDeleteNASA's temperature graph, http://climate.nasa.gov/news/index.cfm?NewsID=249.
ReplyDeleteA better analysis of Hansen's data, http://www.skepticalscience.com/Hansen-1988-prediction-advanced.htm
JSAM: I use the WoodforTrees plotting tool so that all graphs look the same and can be compared to one another. The graph you refer to stops in 2010! The graph I plotted also uses Hansen's monthly data.
ReplyDeleteThe skeptical science piece (which I have read more than once and actually re-read before I posted this evening) is an apology for Hansen's poor forecast. You'll find that our if you go back and read the original Hansen paper. Scenario A is the only one that pertains to current levels of CO2. His forecast was way too high.
Sorry for the typo above.
ReplyDeleteThis comment has been removed by the author.
ReplyDeleteMike - I've read them and disagree with your interpretation. His C projection was good and fits today's data. As for WFT's temperatures see http://woodfortrees.org/plot/wti/mean:12/plot/wti/trend - increasing trend.
ReplyDeleteAs for a more recent analysis this may (or may not) be interesting, http://www.realclimate.org/index.php/archives/2012/04/evaluating-a-1981-temperature-projection/#more-11398.
(Deleted partial earlier post so as not to spam your blog. That would be rude.)
Hi Jsam: The real climate posting was about a 1981 forecast that I had not seen before. It is not germaine to the above posting.
ReplyDeleteLet's be clear: I'm evaluating Hansen's forecast in his 1988 paper which was the basis of his famous testimony before Congress. My posting takes the forecast through March, 2012 versus the data up to the same time.
The woodfortrees graph you posted agrees with my contention: No warming the last 15 years.
Please don't bring oranges in to a discussion about apples.